|
Size: 3491
Comment:
|
Size: 3741
Comment: Continuing ...
|
| Deletions are marked like this. | Additions are marked like this. |
| Line 3: | Line 3: |
| === Loading a model and assigning values === | === Loading a model === |
| Line 54: | Line 54: |
| === Inspecting and assigning values === | |
| Line 103: | Line 104: |
| There are methods for plotting the outcome of the set of analyses. | There are methods for plotting the outcome of the set of analyses that are described more fully in ''Secondary Analysis of Model Results'' (link to be made). A simple example is: {{{ >>> results.SetPlotX("Vmax1") >>> results.AddToPlot("R1") }}} resulting in {{attachment:PlotSSeg.png}} |
Kinetic Modelling
Loading a model
The general form of the description of a kinetic model has been covered in the pages on the ScrumPy Model Description Language. Consider the following two enzyme system as an example:
# Two reactions with reversible Michaelis-Menten kinetics

R1:
    x_A <> B

    Vmax1/K1A * (x_A - B/Keq1)/ (
        1 + x_A/K1A + B/K1B
            )

R2:
    B <> x_C
    Vmax2/K2B * (B - x_C/Keq2)/ (
        1 + B/K2B + x_C/K2C
    )

x_A = 1
x_C = 1

Vmax1 = 10
K1A = 1
K1B = 1
Keq1 = 2

Vmax2 = 10
K2B = 1

K2C = 1
Keq2 = 2

B=0.4
Note that this file contains two reaction definitions with their kinetic equations, followed by initial assignments of the parameters and the variable (B).
There are two limitations on the model specification:
- The identifiers cannot be quoted, and
- No c or C++ key words can be used as identifiers.
On the other hand, it is possible to compute the values to be assigned, as in this example of adjusting an equilibrium constant to its apparent value at the prevailing pH:
pH = 7.5
k2eq = 17.84e8*10**(-pH)
If this model had already been saved as a spy file, then it can be loaded into ScrumPy as follows:
m = ScrumPy.Model()
Inspecting and assigning values
Once it has been loaded, values can be inspected, e.g.:
>>> m[ " x_A " ]    # parameter
1 . 0
>>> m[ "B" ]        # concentration
0.4
>>> m[ "R1" ]       # rate, evaluated with current variable values
3.3333333333333335
They can, of course, also be changed:
>>> m[ " x_A " ] = 2   # parameter
>>> m[ "B" ] = 2       # concentration
However, note:
>>> m["R1"]
3.3333333333333335
>>> m.Eval()
>>> m["R1"]
2.0
That is, the computation of the rate is not updated until m.Eval() is called to force a re-evaluation of the rate with current parameters and concentration values.
The following table shows the methods/attributes of the model m that return a list of the corresponding entities:
Constituent
Values
Identifiers
Parameters
m.GetVec(ScrumPy.Param)
m.ParamNames
Metabolites
m.GetVec(ScrumPy.Conc)
m.sm.rnames
Metabolite rates of change
m.GetVec(ScrumPy.dMet)
m.sm.rnames
Reaction rates
m.GetVec(ScrumPy.Vel)
m.sm.cnames
The corresponding method SetVec takes as parameters one of the same codes as GetVec followed by a vector of values, but the vector must be the correct length ( as indicated by, e.g. len(m.ParamNames)).
Examining steady states of the model
The steady state of the model can be determined with m.FindSS(); if the steady state is found successfully, than m.IsOK() will return True.
A straightforward way to record a series of steady states as a parameter is changed uses the AddStatMonitor method. For example:
>>> results=m.AddStatMonitor()
>>> m["x_A"]=1
>>> m.FindSS()
>>> for n in range(20):
        m["Vmax1"] += 1
        m.FindSS()
        print m.IsOK()
results is a ScrumPy matrix, the columns of which (results.cnames) contain the time, rates, concentrations and parameter values of the model (though the time is always zero in this case). A row is added to the matrix with each successful steady state determination, recording the steady state values.
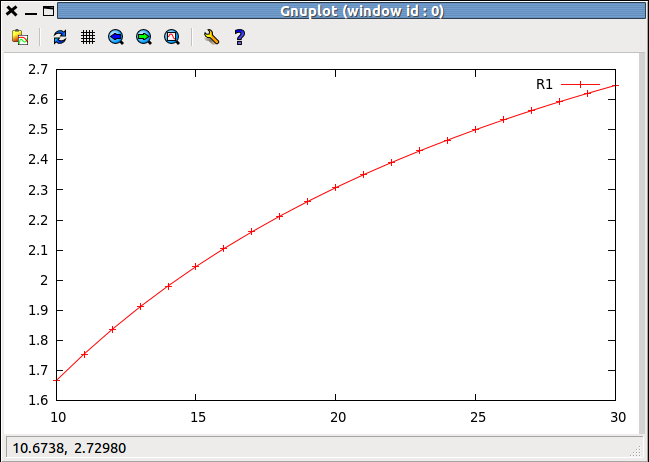
There are methods for plotting the outcome of the set of analyses that are described more fully in Secondary Analysis of Model Results (link to be made). A simple example is:
>>> results.SetPlotX("Vmax1")
>>> results.AddToPlot("R1")
resulting in
